Blog
The internet generates more CO₂ than air travel-make your website part of the solution

Shaun
Creative Director
The internet generates more CO₂ than air travel and the shipping industry. If the Internet were a nation, it would be the 4th largest contributor of carbon emissions on the planet. Most businesses that care about their environmental impact have looked at their energy supplier, travel arrangements and supply chains in order to reduce their carbon footprint. Very few have looked at their website.This article from SOZO founder and Creative Director Shaun Uthup, explains how to measure your website’s carbon output, what tools are worth using, what the numbers mean in practice, and what you can do to reduce your digital carbon footprint with a more sustainable website design.
We take the internet for granted. Open a browser, find a page, watch a video, buy something, move on. We want everything fast and in an instant. But every click transfers data, executes code and consumes energy.
The average web page can produce around 1.76g of CO₂ with every visit. It might seem like a small amount, but when scaled up across billions of visits every day, the internet’s carbon footprint now accounts for roughly 3.7% of global greenhouse gas emissions comparable to the aviation industry and a medium sized country.
For companies serious about their green credentials, it’s increasingly the detail that separates a genuine commitment from a broad claim.
Why websites have a carbon footprint
Every time someone loads a web page, it triggers a chain of energy use; servers, data centres, networks and devices. Each step burns electricity. Most of that electricity still comes from carbon-emitting sources, although the landscape is improving.
The heavier the page-measured in kilobytes transferred- the more energy is consumed at each step.
A bloated eCommerce product page with uncompressed images, a dozen tracking scripts and a slow server response generates significantly more CO₂ than a well-built equivalent. The difference is rarely visible to the user, but it’s entirely visible in the emissions data.
The good news is that for businesses being assessed on their environmental impact, their website is one of the easiest things to measure, and with the right design, improved from both a user and a sustainability perspective.
Most sustainability audits focus on travel, supply chain, or energy bills. Websites rarely feature. But they should and for companies serious about their green credentials, it’s increasingly the detail that separates a genuine commitment from a broad claim.
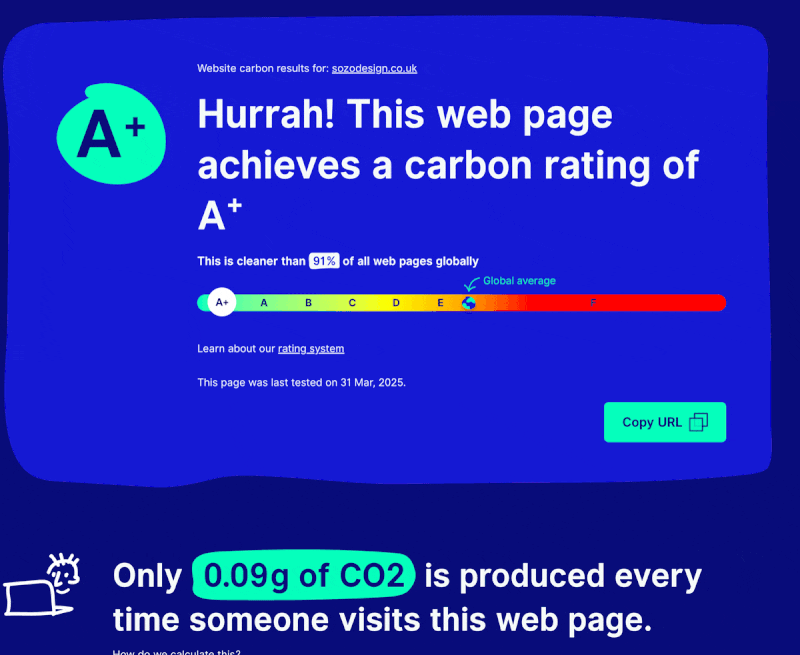
When SOZO redesigned our website we wanted to walk the walk, not just talk the talk. It is now an A+ grade, cleaner than 91% of all websites. Read how we did it.
Measuring your website’s carbon footprint
The first place to start reducing your website’s carbon footprint is to measure its current emissions. There are a number of tools available and we will highlight a few here:
Website Carbon Calculator
websitecarbon.com is the most widely cited tool and the one behind most of the ratings you’ll see shared online. It estimates the CO₂ produced per page view based on page weight, data transfer, and whether the hosting uses renewable energy (which it checks against the Green Web Foundation’s dataset).
The output is a simple gram figure: something like “0.23g of CO₂ per page view” with a percentile ranking against the sites it has tested. This is where SOZO’s rating comes from.
It’s a good starting point. The methodology is transparent and the data is updated regularly. The limitations: it tests a single URL, it can’t account for dynamic content, and the renewable energy check is binary rather than granular.
Digital Carbon Online
digitalcarbon.online assesses the full carbon impact of a website as it is viewed, helps you prioritise reductions and proactively removes carbon emission through integrations with verified carbon removal projects.
Google PageSpeed Insights / Lighthouse
Not a carbon measurement tool specifically, but the data feeds directly into carbon calculations. Lighthouse reports on page weight, render-blocking resources, image compression, unused JavaScript and CSS, all of which translate into bytes transferred, which translates into emissions. If you’re optimising for carbon, Lighthouse is where the actionable fixes live.
The Green Web Foundation’s carbon.txt initiative
thegreenwebfoundation.org maintains the dataset that most carbon tools use to determine whether a host runs on renewable energy. They’ve also introduced carbon.txt, a simple file that hosting providers and site owners can publish to declare their energy sources in a machine-readable format.
What the numbers actually mean
A page that produces 0.5g of CO₂ per view sounds negligible. Multiply by monthly traffic and it changes shape quickly. A site with 50,000 monthly page views at 0.5g per view produces roughly 25kg of CO₂ per month, or around 300kg per year. That’s comparable to a 1,500km car journey.
At the other end, a well-optimised page can sit below 0.1g. The difference between 0.5g and 0.1g across that same traffic is 240kg of CO₂ annually, saved not by installing solar panels or switching energy suppliers, but by compressing images and removing redundant scripts.
The benchmarks from Website Carbon Calculator provide a useful frame:
- Below 0.5g per view: better than average
- Below 0.2g per view: cleaner than roughly 75% of tested pages
- Below 0.09g per view: cleaner than roughly 90% of tested pages
SOZO’s website sits firmly in the top category. That’s not an accident; it reflects the decisions we made at every stage of the build about image formats, hosting infrastructure, script loading and caching strategy.
We created eco-mode which is represented by a toggle on our site that lets the user experience a stripped-back, lower-carbon version of our site. This sustainable web design feature was specifically designed to raise awareness and inspire action across the industry.
What actually drives a website carbon rating
Page weight
This has, by far, the biggest impact on your carbon footprint. Every kilobyte transferred costs energy. The main culprits on high-carbon sites are large image files, excessive JavaScript bundles and web fonts loaded in formats that carry unnecessary overhead.
We have been able to embrace bold typography, solid colours, vector graphics and SVGs to communicate the same ideas in a much cleaner and lighter way, reducing image sizes by around one third in Eco Mode. If your site is still serving PNGs and JPEGs at full resolution, that’s the first thing to fix.
Hosting and energy source
A page served from a data centre running on renewable energy produces significantly lower net emissions than the same page served from a carbon-intensive grid. The green hosting check in Website Carbon Calculator is binary, but the underlying reality is more nuanced – “renewable energy” covers a range of actual arrangements, from on-site generation to purchased certificates.
For eCommerce businesses on Shopify, the position is relatively strong: Shopify’s core platform infrastructure is hosted entirely on Google Cloud, which matches 100% of the energy consumed by its data centers with renewable energy. This ensures that all Shopify websites operate with net-zero carbon emissions. Self-hosted or custom-infrastructure sites need to check their host’s claims directly and look for specifics rather than vague sales language.
Caching and Content Delivery Network (CDN) configuration
A page that caches effectively delivers fewer bytes on repeat visits. A Content Delivery Network (CDN) that serves content from a node close to the visitor reduces network transmission distance. Both reduce energy use. These are infrastructure decisions, but they’re worth revisiting if your site hasn’t been audited recently.
Third-party scripts
Analytics, chat widgets, ad pixels, embedded social social media, each element adds weight and often adds server calls that extend beyond your own hosting. A tag audit on a typical eCommerce site frequently uncovers scripts that are redundant, duplicated or no longer actively used. Removing them reduces carbon and improves performance and data hygiene in one step.
Eco mode shortlisted at the Green Business Awards
Measuring and optimising your core site is the baseline. SOZO’s eco mode goes a step further; a function that lets visitors switch to a stripped-back, lower-carbon version of the site, reducing data transfer, image weight and processor use while keeping the brand experience intact.
It came out of the same thinking that shaped our own website build: if we’re going to talk about sustainable web design, the site itself needs to demonstrate it. Eco mode is currently shortlisted in the Green Business Awards, which reflects a broader shift we’re seeing with clients as sustainability is moving from a values statement to something businesses are being increasingly asked to evidence.
Greener websites are also faster, more SEO-friendly and better for users. The environmental and commercial cases point in the same direction.
How to run your own website audit
- Go to websitecarbon.com and test your homepage. Note the grams per view and the percentile ranking
- Run the same URL through Ecograder or digital carbon online for a broader picture
- Run Google PageSpeed Insights on the same URL and look at the diagnostics tab for the specific files adding the most weight
- Check your hosting provider against the Green Web Foundation database at thegreenwebfoundation.org/green-web-check
- Do a tag audit, either manually in your browser’s network panel or with a tool like TagInspector or ObservePoint and remove anything that isn’t essential
The results give you a baseline. Repeat the test after making changes and you’ll have before and after data that’s worth sharing.
If you’re an eCommerce brand that wants to understand your website’s carbon footprint and what’s worth fixing, we’re happy to run through it. Get in touch.

Sign up to our newsletter
Keen to learn more about how to grow online?
Get our latest advice articles, masterclass
videos and webinars.
curious for more?